Blog

  • Picking Winners by Industry — Step 2: Quality First (Unit Economics + Balance Sheet)

    This is the next brick in the series. In Step 1 we set the lane and built a clean, tradable universe; in Step 2 we tighten that universe with straightforward “quality first” checks—can these businesses earn good returns, convert to cash, and carry sensible balance sheets. I’m not claiming this is the only way to invest; it’s the process I’m using because it forces clarity and helps me make informed decisions. If you see a better tweak, say so—I want this to be useful, not dogma.

    I’m running the exact saved screener from Step 1 inside StockAnalysis.com (same industry, exchanges, country, primary listing, and basic liquidity) and adding quality filters on top. You can follow along with the free version; I use Stock Analysis Pro so I can save and reuse screens as the series progresses. If you decide to upgrade and use my link, I may earn a commission: https://stockanalysis.com/pro/?ref=betterinvestorproject

    What Step 2 does (one line)

    Keep a short list of non-negotiables, then rank everything else—so strong near-misses stay in view instead of getting cut.

    Gate A — Unit economics (earn it, convert it)

    Core (must pass)

    • ROCE ≥ 10%
    • FCF Margin ≥ 5%
    • Operating Margin ≥ 0% OR FCF Margin ≥ 8% (pick one path)
    • Revenue Growth 3Y ≥ 8%

    Flex (score, don’t hard-cut)

    • Gross Margin ≥ 55% (Software-Infra; otherwise use ≥ industry median)
    • EPS Growth (soft): use EPS Growth Years ≥ 1 or EPS Growth 3Y ≥ 8% as a plus—not a gate

    Nice tie-breakers for later ranking: ROCE (5Y), operating-margin trend, revenue per employee, FCF per share.

    Gate B — Balance sheet (quality without fragility)

    Core (must pass)

    • Debt / EBITDA ≤ 3.0
    • Interest Coverage ≥ 5
    • Current Ratio ≥ 1.2
    • Shares Change (YoY) ≤ 8% and (QoQ) ≤ 3%

    Flex (score, don’t hard-cut)

    • Altman Z-Score ≥ 2.5, Piotroski F-Score ≥ 5 (accounting can be noisy—treat as soft)

    Hard pass red flags (still out): negative trailing FCF margin, SBC/Revenue > 20% (software), Debt/FCF > 4, Short % Float > 15% without a near-term, real catalyst.

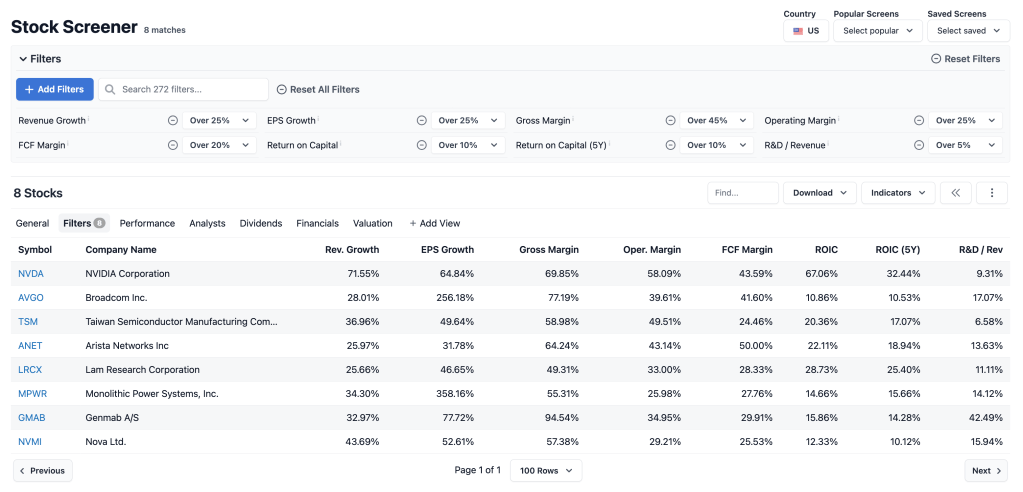
    StockAnalysis.com — exact filters to add (start from your Step-1 saved screen)

    Unit economics

    • Return on Capital Employed ≥ 10 (or Return on Capital (5Y) ≥ 10 if ROCE missing)
    • FCF Margin ≥ 5
    • Operating Margin ≥ 0 (and optionally add FCF Margin ≥ 8 if Op Margin < 0)
    • Revenue Growth 3Y ≥ 8
    • (Soft, optional) Gross Margin ≥ 55; EPS Growth 3Y ≥ 8 or EPS Growth Years ≥ 1

    Balance sheet

    • Debt / EBITDA ≤ 3.0
    • Interest Coverage ≥ 5
    • Current Ratio ≥ 1.2
    • Shares Change (YoY) ≤ 8
    • Shares Change (QoQ) ≤ 3
    • (Soft, optional) Altman Z-Score ≥ 2.5, Piotroski F-Score ≥ 5

    Keep Step-1 gates on: Market Cap ≥ $1B, Average Volume ≥ 300k, Dollar Volume ≥ $10M, Stock Price ≥ $5, Is Primary Listing = Yes, Exchange = NYSE/NASDAQ (AMEX only if liquid).

    Save this screen:Step 2 — Quality & Balance

    A simple quality score you’ll use in Step 3

    When ranking survivors, weight the essentials; near-misses can still win on total score:

    • ROCE 30%
    • FCF Margin 20%
    • Operating Margin 10%
    • Revenue Growth 3Y 10%
    • Gross Margin 10%
    • Debt/EBITDA (inverse) 10%
    • Interest Coverage 5%
    • Dilution (YoY shares, inverse) 5%

    Friendly guardrails for Step 2

    Keep valuation and technicals out of this step. Don’t bend core gates, but let flex items contribute to the score. If a favorite misses a flex threshold by a hair yet crushes ROCE/FCF/leverage, keep it in Tier B and let the ranking decide.

    Where we are, where we’re going

    You now have a broader but still disciplined list—businesses that mostly clear quality bars, with room for near-misses to prove themselves. Next in Step 3, we’ll sanity-check valuation (mid-cycle EV/EBIT, EV/EBITDA, FCF yield—PEG only as a tie-breaker) and build a composite rank so fairly priced quality rises to the top.

  • Picking Winners by Industry — Series Intro

    This is Part 1 of a step-by-step series on how to pick winning stocks by industry. We’ll move in tight, logical stages: define the lane (today), build a tradable universe, layer on quality and balance-sheet filters, set valuation bands, add timing rules, then publish a repeatable shortlist.

    Throughout this series I’ll use StockAnalysis.com for screening, research pages, and saving watchlists. There’s a free version; it’s enough to follow along. I recommend Stock Analysis Pro for saved screens, unlimited access to all data and tools, and many other useful features.

    Step 1: Pick the Right Lane (How to Choose an Industry Before You Touch a Ticker)

    You don’t start with a “hot stock.” You start by choosing a lane where the businesses share the same economics. Do this right and everything downstream—screening, comps, valuation, timing—gets easier and cleaner.

    What “industry” means (and why it matters)

    • Sector = giant bucket (e.g., Technology).
    • Industry = narrow slice with similar revenue drivers and cost structures (e.g., Software – Infrastructure).
    • Compare companies inside the same industry. Cross-industry comps are noise.

    The rule: narrow until the economics rhyme

    You want companies that:

    • sell to the same customer,
    • face the same inputs,
    • share the same cycle.

    If those three don’t match, you’re mixing apples and lawnmowers.

    How to define the lane in a screener (hard, simple switches)

    • Industry: target industry (example: Software – Infrastructure).
    • Exchange: NYSE, NASDAQ. Skip NYSEARCA/BATS (ETFs). NYSE American only if liquid (≥$1B mkt cap, ≥300k avg vol, ≥$10M dollar vol).
    • Country: United States.
    • Is Primary Listing: Yes (avoid ADR/duplicate tickers).

    Stop here. No quality or valuation yet. Clean scope first.

    Deal with mislabels without wasting a day

    Taxonomies differ (GICS/ICB/NAICS). You’ll see oddballs. Let the industry toggle pull a first draft, then manually remove non-peers and add back true peers that got misfiled. Two minutes scanning business descriptions is enough.

    Minimum tradability so you’re not analyzing ghost

    Even in Step 1, kill the unbuyable clutter:

    • Market Cap ≥ $1B
    • Average Volume ≥ 300k
    • Dollar Volume ≥ $10M
    • Stock Price ≥ $5

    This is not “quality.” It’s “I can actually get in and out.”

    How to do Step 1 in Stock Analysis (with screenshots) 

    The walkthrough below demonstrates Step 1 using the Software Infrastructure industry in the United States. You’ll set the screener to that lane, apply basic tradability gates, and save the “base universe” you’ll reuse in later steps. Swap “Software Infrastructure” for any other industry later—the process is identical.

    Goal: define a clean, tradable industry lane. No quality/valuation yet.

    Where to click: Stocks -> Stock Screener

    Add these filters:

    • Industry: e..g Software Infrastructure
    • Exchange: check NYSE, NASDAQ
    • Country: United States
    • Is Primary Listing: Yes
    • Minimum tradability (still Step 1):
      • Market Cap ≥ $1,000,000,000
      • Average Volume ≥ 300,000
      • Dollar Volume ≥ $10,000,000
      • Stock Price ≥ $5

    Save the screener: Saved Screens -> Select Saved -> Enter label (e..g US Software Infra)

    Where We Stand Now

    You picked a precise industry lane and built a clean, tradable universe: primary U.S. listings only, no ETFs, no illiquid junk, and no misclassified outliers. You locked in simple, repeatable screener settings (industry, exchanges, country, primary listing) and added basic tradability gates so every name on your list is actually buyable. You also learned to sanity-check taxonomy labels and keep only true peers whose economics rhyme. That’s the entire point of Step 1—get the scope right before you judge any business.

    Next up (Step 2): we’ll layer in two hard quality filters—unit economics (ROIC, margins, free cash flow) and balance-sheet strength (Debt/EBITDA, Interest Coverage)—to strip out weak operators and leave a shortlist of durable, high-return candidates. Then and only then do we talk valuation and timing.

  • How I Restructured My Portfolio (and How You Can Too)

    How I turned a pile of idle cash into a focused growth portfolio aimed at 20% annual returns.

    This week I finally stopped thinking about fixing my portfolio and actually did it. After years of random buys, half-hearted holds, and a lot of “it’ll probably go up,” I decided to get serious and rebuild everything from the ground up.

    If you’ve been sitting on a pile of cash or a messy mix of funds wondering where to start, this post should help. I’ll walk through how I approached my portfolio overhaul, what tools I used for analysis, and the exact framework I followed to buy new stocks.

    Affiliate Disclosure: I used StockAnalysis Pro for all screening and valuation data. It’s clean, fast, and actually fun to use. If you use my link, it helps support this project — no extra cost to you.

    Why I Restructured

    After holding a mix of solid names and impulse buys for way too long, I finally sold off a big chunk of my portfolio that didn’t fit my long-term goals. Things like CMG, LULU, AMZN, and extra SPY shares were fine companies, but they didn’t serve the strategy I’m trying to build toward.

    Once I sold those positions, I freed up about $60,000 in cash. That gave me a clean slate and the chance to actually build the kind of portfolio that could hit my goal: 20 percent annual returns over the next several years.

    The idea wasn’t to get “safer.” It was to get smarter and focused, deliberate, and built around businesses that have both strong fundamentals and durable long-term trends behind them.

    Here’s what my portfolio looked like after freeing up that cash and cleaning house:

    • Equities: 43 percent
    • Cash: 57 percent

    Breakdown:

    • SPY – $42,320
    • NVDA – $545
    • DDOG – $782
    • NFLX – $1,113
    • SHOP – $1,169
    • Cash – $61,816

    Basically, I was sitting on a lot of dry powder. The goal was to put that cash to work, not recklessly, but intentionally into sectors with real growth drivers and pricing power.

    My New Portfolio Structure (and How It Helps Me Reach 20%)

    I rebuilt my portfolio to balance conviction with diversification. The goal is simple: hit 20 percent annualized returns by leaning into innovation while managing downside risk.

    CategoryTarget %Rationale
    Core AI + Semiconductors25%Picks and shovels of the AI gold rush (NVDA, AVGO, SMCI, TSM)
    Software / Cloud / Cybersecurity20%Recurring-revenue compounders (DDOG, CRWD, NOW)
    E-commerce / Fintech15%Balanced growth (MELI, SHOP)
    Index ETF anchor15%SPY or QQQ for steady exposure
    Energy / Infrastructure / Hard assets10%Inflation hedge and real-world stability (SLB, XOM, CCJ)
    International Growth5%Optional India ETF (INDA) or additional MELI exposure
    Cash / T-Bills10%Liquidity for pullbacks or quick entries

    This structure gives me multiple paths to growth.
    AI and semiconductors drive the biggest upside. Software and fintech offer scalable, recurring revenue. Energy and infrastructure hedge inflation and add balance. The cash buffer gives flexibility for new opportunities without ever being forced to sell at a bad time.

    It’s not about predicting the next big winner, it’s about creating a system where multiple things can win at once.

    Core AI + Semiconductors: The Conviction Bet

    AI may feel like the party everyone already showed up to, but I still think we’re early.
    We’re just scratching the surface of AI-generated entertainment, AI-driven shopping, and yes, AI companionships. Whether that excites or terrifies you doesn’t matter. It’s happening.

    That’s why I’m allocating 25 percent to Core AI and Semiconductors. These are the companies building the infrastructure that everything else runs on.

    My shortlist: NVDA, AVGO, TSM, and ANET.

    The Fundamental Screen

    To avoid buying hype, I built a simple but strict checklist using StockAnalysis Pro.

    Each stock had to meet at least 7 out of these 9 targets:

    MetricTarget (Buy Zone)Why It Matters
    Revenue Growth (YoY)≥ 25% (high-growth)Confirms strong demand
    EPS Growth (YoY)≥ 25%Shows margin leverage
    Gross Margin≥ 60% (design) / ≥ 45% (manufacturing)Pricing power
    Operating Margin≥ 25%Efficiency and scale
    Free Cash Flow Margin≥ 20%Real cash generation
    ROIC≥ 10%Capital efficiency
    Guidance TrendRaised or reiterated higherConfirms management credibility
    Debt-to-Equity< 0.5Financial safety
    R&D Intensity≥ 5%Continuous innovation

    If a company hit 7 or more of these, it passed.
    NVDA, TSM, and AVGO all passed easily. ANET looks strong but I’m waiting for earnings to confirm.

    My Actual Plan

    StockTargetInitial BuyLogicStop
    NVDA$5K$2.5K nowTrend intact, strong fundamentals~10% below entry
    ANET$5K$2.5K nowTest position before earnings~10% below entry
    TSM$5K$2.5K nowAdd if semis confirm~10% below entry
    AVGO$5K$2.5K nowWait until after NVDA earnings~10% below entry

    I’m also trimming SPY to 15 percent of the portfolio and rotating out of funds that haven’t outperformed the market in years. If it can’t beat SPY, it’s dead weight.

    Going Forward

    1. Reevaluate monthly and compare performance to SPY or QQQ
    2. Rotate out of any laggard that underperforms by more than 10 percent
    3. Keep expanding exposure into software, e-commerce, and infrastructure
    4. Maintain 10 percent cash for optionality and sanity

    The goal is to stay flexible. Markets change fast, and I want a system that can evolve without panic.

    Final Thoughts

    This restructure wasn’t about chasing hype or trying to double my money overnight. It was about building a disciplined framework to consistently hit my 20 percent annual goal.

    If you’re trying to do the same, define what success looks like for you, filter out what doesn’t serve that goal, and build around sectors with real staying power.

    If you want to use the same screening tool I used, check out StockAnalysis Pro. It made the entire process way easier and gave me confidence in the numbers I was looking at.

    Now it’s time to let the AI miners do their thing and hope my stop losses don’t get hit before the next earnings season.

  • The great restructuring

    This past week has marked the beginning of my journey to become a better investor as I tackled getting my portfolio in order after years of neglect and thoughtless purchases. 

    My goal is to create a portfolio that can outperform the market by having at least 25% returns over the next 5 years. I arrived at that number after figuring out where I want my life to be 5 years. I am 26 years old, I have a fiancé, and in 5 years we plan to start a family. We want to raise our family in the mountains in Colorado, and I want to be as present as possible in my family’s life. So, at least $2 million in the bank would make that life absolutley possible. I currently have about $250K saved up, and plan to save about $2000 annually.

    Before this week, my stock portfolio consisted of the following:

    • ~20% in random stocks (some were great choices, some not so much, but all were bought without considering how they fit into my portfolio to help me achieve my goals).
    • ~20% In the S&P 500 via SPY.
    • ~60% in a slow moving brokerage that averages about a 7% return.

    To achieve my desired 25% annual return, I plan to build a stock portfolio consisting of the following:

    • ~35% in high conviction, mega growth stocks.
    • ~25% in mid cap, high beta growth stocks.
    • ~10% in core growth ETFs.
    • ~10% in international growth markets.
    • ~10% in dry powder/cash to redeploy when needed.

    To be perfectly clear, that proposd portfolio is certainly a draft. I worked with Chat GPT to determine that, but I may re evaluate it that is really the best allocation of capital for my goal.

    When it came to cleaning house, I was nervous to sell stocks to free up the capital necessary to create an organized, high returning portfolio because I was fearful of missing gains in the immediate future. So, I took emotion out of the decision and followed this process for each stock to determine if it should be sold:

    1. Determine if stock belongs in my new portfolio. This was difficult, and I erred on the side of selling, as I want a clean slate.
    2. If not, sell the stock.
      1. If the stock was on the rise, I used Stop market orders. For example, I owned LULU, and it was on the rise this past week, so I put a stop order in for 180 to capture some of the gains it had.
      2. If the stock was stagnant I sold.

    For the most part, the stocks I owned made up a very small percentage of my overall portfolio. So, selling was more emotional than rational. Eventually, I realized losing $500 so that I can focus on getting my portfolio in shape is money well spent.

    Anyway, this week has been a bit of a grind at my job, so I’ll leave this post fairly brief. Next week, I will have more updates on the new structure of my portfolio and how I came to that decision, and what stocks I am considering to buy.

    Thank you for reading, and I would love to hear your feedback on my first steps for creating my dream portfolio, so please drop any thoughts in comments! Here are some questions to get you started:

    1. What shape is your portfolio in? How does it align with your investment goals?
    2. What do you think of my approach freeing up capital to restructure my portfolio?
    3. What are your thoughts on using Stop market orders when ou want to eventually ditch a stock?

  • Welcome to the Better Investor Project

    Hello, and welcome to the Better Investor Project.

    Before I dive into the goal of this project, I want to share a little about myself. I am from Colorado, 26 years old, engaged, and a software engineer. Okay, now lets get back to investing.

    I am a novice investor and, since I am still new to investing, I have hope that I can beat the market and make fortune from my couch. I have read and listened to my fair share of books on the best investing strategies, and time and time again I hear that you can’t beat the market, you should just invest in the S&P and hope you for the best.

    Well, f***k that. Call me naive, because I am. But that’s not going to stop me from trying to master the art of picking winners.

    I see all of these stocks that have 100% gains over the course of a year, why wouldn’t I just work harder on finding those stocks? Intuition tells me, many have tried, and many have failed. So I will probably be the next to fail.

    So that’s my mission, to find gem stocks. But, my ultimate goal is to learn more about investing so I can teach others, as that is what bring’s me joy. However, I do also enjoy investing. I like the idea of having faith in a a company’s success, not because of headlines or buzz words, because I did the research and I believe the company has everything in place to be successful, and at worst not go to zero.

    Anyway, thank you for visiting, enjoy the journey, and hopefully we can all become better investors.